


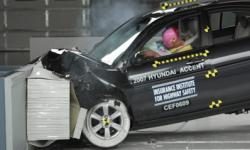
Crash test dummies aren’t just props for cartoons or rock bands. They are the unsung heroes of automotive safety, saving lives every time a vehicle hits an obstacle. Despite cars getting safer year over year and overall fatality rates dropping, motor vehicle crashes remain a leading cause of death and injury in the United States. The reason? Rigorous testing protocols. These programs dissect every impact to ensure the metal and glass on our roads actually protect the people inside.
Зміст
How Hybrid III Dummies Mimic Human Physiology
Frontal crash tests in the U.S. rely on a single standardized actor: the Hybrid III dummy. This consistency is non-negotiable. You can’t compare safety ratings if every manufacturer uses a different measuring stick. The Hybrid III is engineered to replicate human biomechanics with unsettling accuracy.
Take the spine, for instance. It isn’t a single rod. It’s a stack of metal discs separated by rubber pads. This layered construction mimics the flexibility and shock absorption of a real human vertebral column. When a crash occurs, that spine flexes and absorbs energy just like yours would.
These dummies come in various sizes, categorized by gender and percentile. The most common is the 50th-percentile male. It represents the median male body—larger than 50% of the population, smaller than the other 50%. Weighing in at 170 lbs (77 kg) and standing 70 inches (1.78 m) tall, this specific dummy is the baseline for most federal safety evaluations.
The Instrumentation Inside the Shell
A dummy is useless without data. To capture exactly what happens to a human body during a collision, Hybrid III dummies are packed with sensors. Three main types collect the vital numbers: accelerometers, load sensors, and motion sensors.
Accelerometers Measure Deceleration Forces
The primary job of an accelerometer is to measure acceleration in a specific direction. In a crash, you aren’t accelerating; you are decelerating violently. Accelerometers track how fast that change in speed occurs.
Why does this matter? Because injury probability is directly tied to the rate of change. Hit a brick wall? Your head stops instantly. High deceleration. Broken bones. Hit a pillow? The pillow crushes, slowing your head down gradually. Low deceleration. No injury.
Hybrid III dummies have accelerometers embedded in critical areas. There is a triaxial unit in the head measuring fore-aft, up-down, and left-right movement. Others are placed in the chest, pelvis, legs, and feet. This network of sensors tells researchers exactly how much force each part of the body withstands.

Head Acceleration Metrics
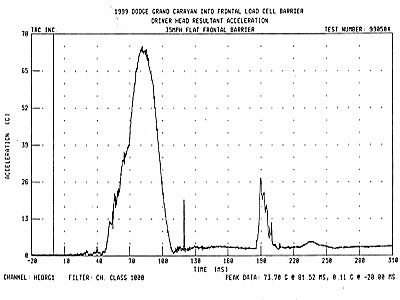
The data captured during that 35 mph (56.3 kph) frontal impact tells a chaotic story. Look at the head acceleration graph. It’s not a flat line. It spikes and drops violently. This fluctuation maps the actual physics of deceleration. The highest peaks occur when the head meets resistance. That resistance usually comes from hard interior structures or the deploying airbag. The airbag doesn’t just catch the head. It manages the stop. If it’s too rigid, the g-forces spike. If it’s too soft, the head keeps moving. The graph proves the head slows down in jagged bursts, not smooth curves.
Internal Load Cells
Crash dummies are instrumented with precision load sensors embedded deep within the torso and limbs. These aren’t simple pressure pads. They are strain gauges and load cells that quantify the force transmitted through the skeleton. When the body hits the dashboard or seatbelt, the dummy records exactly how much load each bone and joint endures. This data reveals whether the femur will break or if the sternum will fracture. It turns a violent collision into a stream of numbers. Engineers use these readings to tweak seatbelt pretensioners and side-impact airbags. The goal is simple: keep the numbers below injury thresholds.
Decoding Femur Load in Frontal Crashes
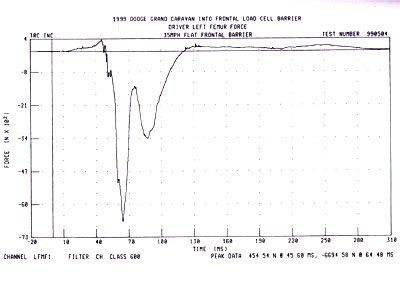
That graph from the NHTSA isn’t just abstract data. It maps the exact force hitting a driver’s femur during a 35-mph frontal impact. You’re looking at Newtons, not pounds. The peak load matters because it tells you the breaking point. Once that threshold is crossed, the bone doesn’t just bend. It snaps.
This metric is critical for understanding injury risk. High femur forces often correlate with serious lower-body trauma. Engineers use these numbers to tweak seatbelt tensioners and knee bolster designs. The goal isn’t just to survive the crash. It’s to walk away without a fracture.
Chest Deflection Sensors
Inside the dummy’s chest, things get different. You’ve got movement sensors here. They track chest deflection. That’s how much the ribcage compresses under load.
Unlike the femur, which deals with direct structural limits, the chest sensors monitor soft tissue and organ protection. When the steering wheel or dashboard pushes in, the ribs buckle. These sensors quantify that buckle.
It’s a direct read on thoracic injury potential. More deflection usually means higher risk to the heart and lungs. The data feeds into side-impact and frontal protection standards alike. You want minimal deflection. Ideally zero. But physics is rarely kind.
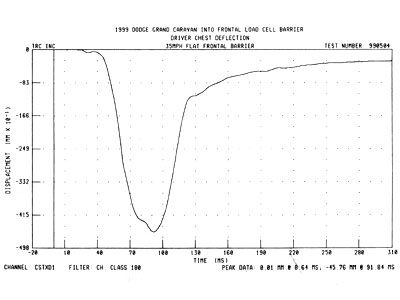
That chest compression scan tells a specific story. In this scenario, the driver’s rib cage takes a direct hit, compressing roughly two inches. That is 46 millimeters of bone bending inward. Painful? Absolutely. Lethal? Not necessarily. It sits in that gray zone where survival is likely, but the bruising lasts for weeks.
But scans are sterile. Reality is messier.
The National Highway Traffic Safety Administration (NHTSA) doesn’t just look at data points. They run full-scale tests to see what actually happens when metal meets metal. The New Car Assessment Program uses two main setups. They are designed to mimic the worst mornings of your life.
The Frontal Wall Test
This is the classic head-on collision. The vehicle hits a solid concrete barrier at exactly 35 mph. That is 56 kilometers per hour. It sounds slow until you feel it.
Why 35 mph? Because physics says it. A 35-mph hit into a fixed object creates the same force as two cars of similar weight slamming into each other, each traveling at 35 mph. The energy doesn’t disappear. It has to go somewhere. Usually, into the passenger cabin.
The Side Impact Sled
Side crashes are different. They happen fast. Often at intersections. One driver runs a red light. The other is just trying to get to work.
To simulate this, NHTSA uses a sled. It weighs 3,015 pounds. That is 1,368 kilograms of steel and rubber moving sideways. The sled has a deformable bumper. It’s not a hard wall. It mimics the front end of another car crumpling upon impact.
The sled hits the side of the test vehicle at 38.5 mph. Wait. Why the extra speed? Because of the angle. The sled’s tires are tilted. This changes how the force transfers. When you run the numbers, the energy involved equals a 35-mph side impact. The angled wheels absorb some energy differently than a straight-on crash. It’s subtle. But in a crash test, subtle matters.
This setup replicates a sideswipe. A car crossing an intersection gets hit broadside. The door buckles. The window shatters. The airbag deploys. The question isn’t if it hurts. It’s if the cabin holds its shape.
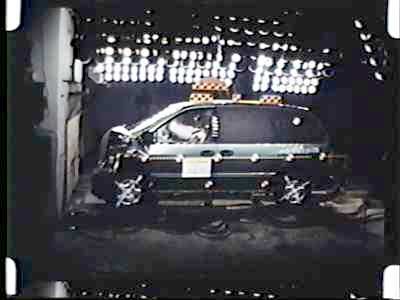
Decoding the Crash Test Paint
The real story of a collision isn’t just in the metal. It’s in the smears.
Before the dummies ever sit in the driver’s seat, researchers cover specific body parts in high-visibility paint. Why? Because high-speed cameras can’t always tell which bone took the hit. The paint acts as a forensic map.
Each region gets a distinct color. The face might be blue. The knees red. The skull another shade entirely. This isn’t decoration. It’s data.
When the crash happens, that paint transfers. It leaves a record of impact.
Look at the NHTSA footage. The blue paint on the dummy’s face ends up smeared across the deployed airbag. That tells you the face made contact. The airbag did its job, but the force was there.
Then there’s the left knee. Painted red. It’s pressed against the steering column. That’s a problem.
The steering column shouldn’t move. If it does, the driver’s legs take the brunt. In some older designs, the column collapses or shifts. In others, it stays rigid. The red paint shows exactly where the energy went.
This method is old school. But it works. You don’t need sensors on every joint to see what happened. You just need to know where the paint went.
“The dummy’s knees, face and areas of the skull are each painted with a different color.”
It’s simple. It’s visual. And it’s hard to argue with.
The video runs for two minutes and thirty-three seconds. Watch the paint transfer. Watch the knees. Watch the airbag.
That’s where the truth lives.
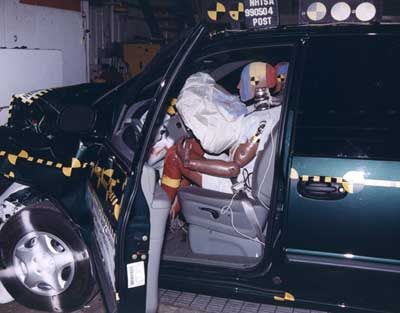

Tracking Impact Points
The crash test dummy’s skin is a map of violence. That multicolored paint isn’t for aesthetics. It’s forensic evidence. When sensors in the head register a spike in acceleration, the paint reveals exactly what happened next.
It shows which body part struck which interior surface. A bruise on the knee matches a scuff on the dashboard. A smear on the shoulder aligns with the A-pillar. This correlation is critical. It allows engineers to pinpoint weak spots in cabin design.
Without this visual data, they are guessing. With it, they can engineer reinforcements. They can reshape airbags. They can change door frame geometry. The goal is simple: prevent that specific injury in the next generation of vehicles.

The 35-Mph Frontal Impact Reality Check
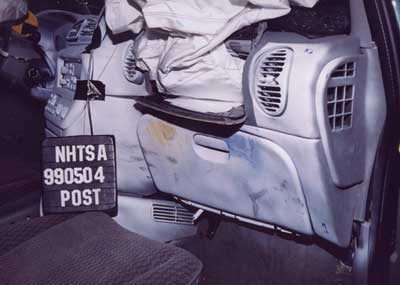
Look at the dummy in the front passenger seat. Its knees are smashing into the dashboard. That’s the immediate reality of a collision. But notice what didn’t happen. No engine block. No radiator. No metal shards from the engine bay punched through the firewall into the cabin. This isn’t luck. It’s engineering. Most vehicles are built with a subframe and engine mounts designed to collapse in a specific way. When the car stops abruptly, momentum drives the engine backward and downward, away from the people inside. It’s a controlled failure designed to save lives.
Now, we ramp up the speed. We’re moving to a 35-mph frontal-impact test. This is where the physics get serious.
Preparing the Crash Vehicle
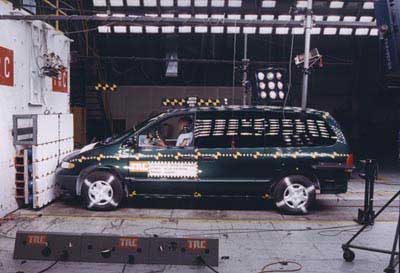
The van in the photo below is locked and loaded. It’s not just sitting there. It’s ready to break.
The crash dummies are strapped in. Their positions are critical. Every joint angle is measured before the hammer drops. The instrumentation is connected. Sensors are taped to the dummy’s head, chest, and legs. Wires run along the body, leading to data recorders that will scream with numbers the moment impact happens.
But a light car doesn’t behave like a full car. So, we cheat. Or rather, we standardize. Ballast weights are added to the van. Why? Because a test vehicle needs to match the mass of a fully loaded vehicle. Weight distribution matters just as much as total weight. If the balance is off, the crash dynamics change. The vehicle might twist differently. The suspension might react unpredictably. The results won’t be comparable to real-world data.
Speed verification is next. A sensor is mounted to the chassis. It’s positioned precisely. Its job is simple. It must pass through a magnetic pickup loop at the exact moment the vehicle strikes the barrier. This triggers the data capture. If the timing is off by a millisecond, the entire test could be voided. Accuracy isn’t optional here. It’s everything.

The Mechanics of Impact
The setup is almost clinical in its precision. Fifteen high-speed cameras, positioned at various angles including directly beneath the vehicle, capture the event at 1,000 frames per second. This isn’t just documentation; it’s forensic data collection. The vehicle is backed away from the rigid barrier, sensors calibrated, and then locked onto a pulley system mounted within a dedicated track.
When released, gravity and tension do the work. The minivan accelerates down the runway, slamming into the stationary barrier at exactly 35 mph. The physics of the stop are brutal and brief. The entire deceleration event—from initial contact to a complete halt—takes only 0.1 seconds.
Decoding the Safety Rating
What happens in that tenth of a second determines the score. We are looking at the aftermath of this frontal-impact test. The structural integrity held up well enough to earn the vehicle a four-star safety rating for both driver and front passenger occupancy.
A four-star rating in a frontal crash test indicates robust protection for occupants, though not the absolute maximum of five stars.
This outcome is typical for modern minivans, which prioritize cabin space and crash absorption. The cameras captured the crumple zones engaging as designed, managing the kinetic energy transfer. While the vehicle stopped dead, the occupants inside experienced forces that the safety cage was built to mitigate. It’s a stark reminder of how engineering constraints play out in real time. The metal bends. The sensors flare. The rating is assigned.
There are still other scenarios to consider. Side impacts? Rollovers? The frontal crash is just the first chapter in a much longer safety story.
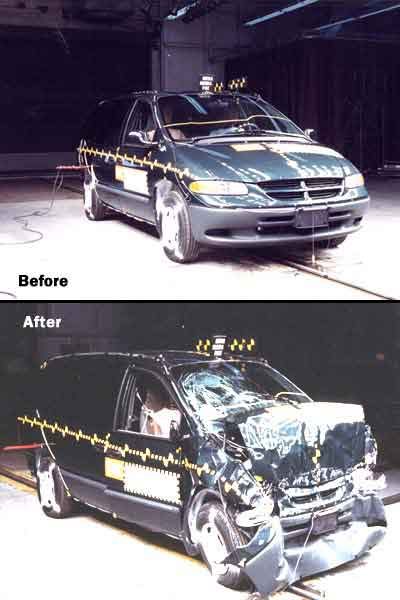

How Front-End Crush Protects Occupants
The visual evidence from NHTSA testing is stark. Look at the photos of the vehicle’s front end, captured both before impact and immediately after. What you’re seeing isn’t just wreckage; it’s physics in action. The nose of the car is completely crushed. To some, this looks like failure. To safety engineers, it’s a successful execution of design.
This deformation is intentional. It’s not a flaw. The structure is engineered to collapse in a controlled manner. Why? Because kinetic energy has to go somewhere. When a car traveling at speed hits a solid barrier, that energy doesn’t just vanish. It needs to be absorbed. If the car remained rigid, that energy would transfer directly to the occupants.
Think of it as a sacrificial layer. The front crumple zone takes the hit. It deforms. This process slows the vehicle down over a longer distance and time, rather than an instantaneous stop. That gradual deceleration is what keeps the passengers inside the survival cell intact.
“The car has to get crushed and collapse in order to absorb the kinetic energy and stop the car.”
A rigid front end would act like a brick wall. The impact would be jarring. Bones would break. Organs would suffer. By allowing the metal to buckle, the vehicle manages the force. The cabin stays upright. The seatbelts and airbags work within a predictable environment. The crumple zone does the heavy lifting.
This is why modern safety ratings rely so heavily on crash test results. They measure how well the car gives way. A car that doesn’t crumple enough often fails to protect its occupants from excessive g-forces. It’s a counterintuitive truth. The worse the car looks on the outside, the safer it might be on the inside. As long as the A-pillars hold. As long as the footwell doesn’t intrude. The crushed metal is proof the system worked.
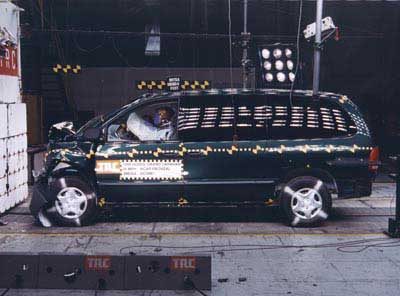

The Physics of Survival
The van is essentially gone. The front end is crushed all the way back to the front wheels, which have been pushed rearward. In this specific impact, the vehicle shortened by 23 inches (58 cm). That is a lot of metal surrendering to kinetic energy.
Obviously, the ideal crash is one that never happens. But if you are locked into a collision, you need the best possible chance of walking away. How do safety systems converge to create that smoothest possible deceleration?
Survival comes down to managing kinetic energy. At 35 mph (56 kph), your body carries a specific amount of energy. When you stop dead, that energy drops to zero. To avoid injury, you need to shed that energy as slowly and evenly as possible. The car’s safety suite is designed to do exactly that.
How Smart Air Bags Work
Ideally, your vehicle has seatbelt pretensioners and force limiters. These systems tighten your belts almost instantly after impact—before the airbag even begins to deploy. Your seatbelt absorbs the initial forward energy. Milliseconds later, the restraint force would become painful, so the force limiters engage. They prevent the belt from strangling you with excessive pressure.
Then, the airbag deploys. It catches your forward motion, shielding you from hard interior surfaces. In this hypothetical scenario, every layer of protection worked in sequence. Without a seatbelt, you miss that first stage of energy absorption. You then slam into the airbag with far more force, increasing the risk of severe injury. Many cars already feature pretensioners and limiters, but the technology is evolving rapidly.
The Rise of Smarter Restraints
Airbags seem to be sprouting from every corner of the cabin. If they keep your body from impacting hard objects, they are doing their job. But there is always room for refinement. The current focus on safety equipment is shifting toward intelligence.
The most significant recent advancement is the smart air bag. These systems deploy at varying speeds and pressures based on the occupant’s weight and seating position, as well as the crash’s intensity.
Traditional airbag deployments can sometimes cause serious injury or even death. Advanced frontal air bag systems are designed to mitigate this risk while enhancing overall performance. The industry is taking this seriously enough that an amendment to Federal Motor Vehicle Safety Standard No. 208 mandates the change. Manufacturers must install these systems in all new models. By September 1, 2005, all 2006 model year vehicles must be equipped with this technology.
Future Trends in Automotive Safety
Looking ahead, seatbelts will likely adopt similar sensing capabilities. They will detect occupant weight and position, adjusting tension and maximum force automatically.
Technology is allowing automakers to build safer, smarter vehicles. Consumers are voting with their wallets, endorsing this trend. It may take destroying countless cars and crash test dummies, but the data extracted from automotive crash tests provides the roadmap. That information is the only thing standing between you and your loved ones and catastrophic injury in an accident. The systems are getting better. The question is whether they will be smart enough when you need them most.
How NHTSA Ratings and Airbag Standards Define Modern Car Safety
The safety landscape for drivers has shifted dramatically. It isn’t just about steel and glass anymore; it is a primary selling point. Buyers actively seek vehicles that protect them, and manufacturers are responding. In the US, the National Highway Traffic Safety Administration (NHTSA) drives this change by crashing cars and analyzing the data to push safety standards higher.
Carmakers do the heavy lifting too. They are legally required to certify that their vehicles meet Federal Motor Vehicle Safety Standards (FMVSS). These rules are granular, covering everything from turn signal brightness to crashworthiness. A manufacturer must ensure that if an NHTSA agent walks into any dealership, buys a car, and smashes it at 30 mph, it passes every test. To guarantee this across different engine and transmission combinations, a company might destroy 60 to 100 prototype vehicles before hitting the market.
Failures are rare, but the NHTSA needed to challenge automakers further and give consumers clearer data. That led to the creation of the New Car Assessment Program (NCAP). Here, cars are battered at 35 mph (56 kph) in frontal and side impacts. The results? A rating based on the likelihood of occupant injury. You should check these ratings online before signing any papers.
Defining Serious Injury and Injury Metrics
How likely are you to walk away from a wreck? To answer that, we first need to define “serious injury.” Crash-test researchers use the Abbreviated Injury Scale (AIS) to categorize damage. This system ranks injuries from 1 to 6:
- 1: Minor cuts and bruises
- 3: Serious injury requiring immediate medical treatment; potentially life-threatening
- 6: Fatal
This scale provides the backbone for the star ratings you see on certification labels.
Frontal Impact Star Ratings
The New Car Assessment Program calculates star ratings based on the worst score among three specific metrics during a frontal crash test:
- Head Injury Criteria (HIC): Measures the likelihood of head trauma.
- Chest deceleration: Tracks how hard the torso is slowed down.
- Femur load: The force applied to the thigh bones.
To earn a 5-star rating in frontal tests, all three criteria must show less than a 10% chance of severe injury. The stars are awarded separately for front seat passengers.
Frontal-Impact Star Scale:
* 5 Stars: 10% or lower chance of serious injury
* 4 Stars: 11% to 20% chance
* 3 Stars: 21% to 35% chance
* 2 Stars: 36% to 45% chance
* 1 Star: 46% or greater chance
Side-Impact Star Ratings
Side collisions present different physics. Here, the rating depends on two metrics:
- Thoracic Trauma Index (TTI): Measures chest damage.
- Lateral Pelvic Acceleration (LPA): Measures force on the hip bones.
A 5-star rating in side impacts requires both metrics to indicate less than a 5% chance of serious injury.
Side-Impact Star Scale:
* 5 Stars: 5% or lower chance of serious injury
* 4 Stars: 6% to 10% chance
* 3 Stars: 11% to 20% chance
* 2 Stars: 21% to 25% chance
* 1 Star: 26% or greater chance
Advanced Frontal Airbag Compliance
According to NHTSA data, the following vehicles are certified to meet advanced frontal airbag requirements, either currently or by September 1, 2004:
- BMW: 525i, 530i, 545i; 645Ci & 645Ci convertible; X3 (2.5i & 3.0i); Z4 roadster (2.5i & 3.0i)
- Dodge: Durango
- Jeep: Liberty
- Ford: Escape, F-150, Taurus/Sable
- Mazda: 3, Tribute, MPV
- Jaguar: S-TYPE, XJ, X-TYPE
- Cadillac: Escalade, Escalade EXT, Escalade ESV
- Chevrolet: Avalanche, Silverado, Suburban, Tahoe
- GMC: Yukon, Yukon XL, Yukon Denali, Yukon XL Denali, Sierra
- Honda: Accord, Odyssey
- Acura: MDX
- Hyundai: Elantra
- Kia: LD
- Mitsubishi: Galant
- Nissan: Pathfinder Armada, Quest, Titan (King Cab & Crew Cab)
- Subaru: Legacy, Outback
- Suzuki: Grand Vitara XL-7
- Lexus: RX330, ES330
- Toyota: Camry, Highlander
- Volkswagen: New Beetle, New Beetle Convertible
Source: National Highway Traffic Safety Administration
For those digging deeper into the mechanics of protection and performance, understanding how force, power, torque, and energy interact is essential. The same principles apply whether you are looking at how Champ Cars or NASCAR vehicles handle extreme stress. If you want to see the raw data, the Insurance Institute for Highway Safety offers extensive vehicle ratings. And while some videos might show cars hitting concrete walls at 200 mph with no driver injury, real-world safety is about consistent protection, not just extreme outliers.


